As The (Tri Polar) World Turns - August 2018
MACRO THEMES
We continue to expect a challenging second half of the year as noted in our 2nd Half Outlook. We remain focused on discerning the answers to the three key questions for financial assets that we posed in the Outlook. Lets update each one individually.
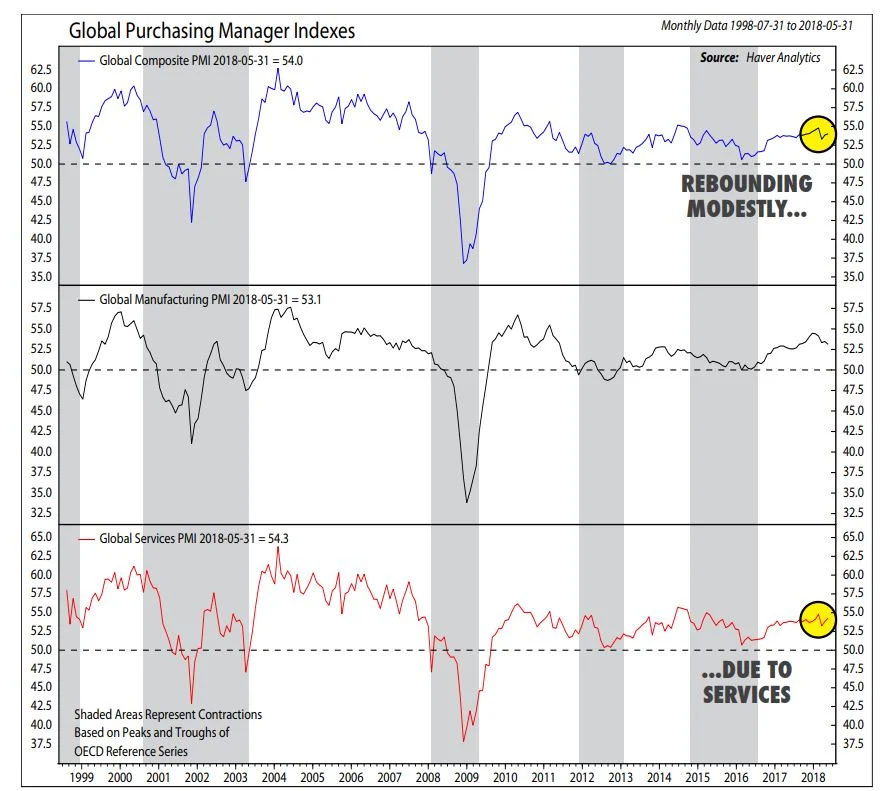
The first question asked whether relatively strong global growth would overcome rising trade tensions? We answered yes and argued such a response supports our slight equity overweight. So far, so good given July’s equity performance. The data flow has been pretty supportive of growth (PMIs, Citi’s Economic Surprise Indices (CESI) & recent export orders in China, among others) suggesting the global economy has the ability to withstand current trade tensions.
Chart 1: Global PMI Rebounding
Source: Ned Davis
Two other factors stand out in our Tri Polar World framework. First, China’s decision to employ fiscal stimulus to hedge any potential adverse trade effects. Secondly, the trade tiffs have centralized around US - China trade after the US and the EU agreed to talk trade rather than engage in the tariff fight.
These factors support the global growth profile for two reasons: one, China is better positioned than most to ride out a trade battle with the US; in a Financial Times piece I wrote a few years ago, I termed China a “master juggler” arguing that China has many levers it can pull to stabilize its macroeconomic environment. This remains very much the case today.
Secondly, the EU is smart to take itself out of the firing line given its large current account surplus and still limited domestic demand profile. Employment and wages are rising as is loan growth but exports remain a large & important component of the European economy. One of Europe’s main 2H worries is tariff risk spillover to its export machine even if it is not on the trade front line. Something to watch carefully.
This brings us to the second question we posed, namely will the 1st H US – EU growth divergence persist throughout the second half? We answer no & continue to expect the growth divergence to narrow as the year progresses with Q2 likely to mark the high point in Q/Q US growth and perhaps the low point for EU growth as the European economy escapes its soft patch and gains velocity. One can look at Europe’s CESI picking up while that of the US rolls over as shown in Chart 2.
Chart 2: CESI Divergence – Europe Up, US Down
Source: Bloomberg
Importantly, our Global Risk Nexus (GRN) Scoring System work suggests that US – EU divergences extend beyond just GDP to include monetary policy, political risk and equity market levels. In this regard, we see growing potential for the Fed to pause in its rate hike process; given the near 65% probability of two more hikes currently priced in the futures market, this would come as a significant surprise. A persistent Fed would imply growing risk that 2019 could be when the dreaded Fed policy mistake manifests itself.
The first half of the year featured political risk from one part of Europe to the next: Brexit woes, Italian jobs and German upheaval. We expect political risk to shift back across the Atlantic as the year progresses. The US faces threats of a Sept Govt shutdown, the Nov mid term elections & the Mueller investigation, among others. This has yet to affect US financial assets which have benefited as a safe haven with the flows to prove it. We wonder what might happen if some of those flows reverse? Europe for example has suffered some $55B of equity fund outflows while the USD and Euro both sit at important technical levels (support for Euro 1.15-1.153, resistance for USD 95.5-95.56).
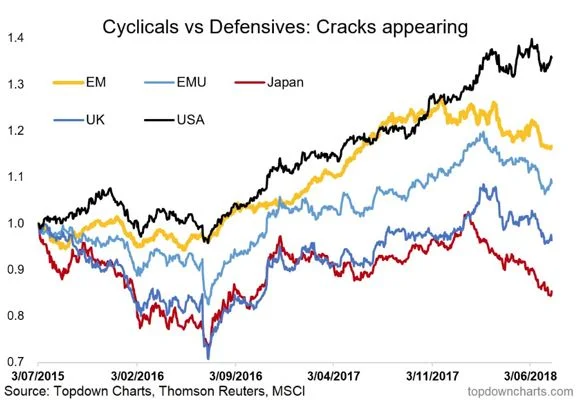
The third question asked whether US equity and growth stock leadership would persist through the 2H. We expect the performance between regions to resemble July more than the 1st half of the year with European equity performance much more in line with that of the US. Should we see a rotation away from tech and growth to defensives and value we would expect Europe to outperform the US.
As Chart 3 below demonstrates, Defensive sectors have been doing well relative to Cyclicals in many parts of the world.
Chart 3: Global Defensives Taking the Lead
Should this rotation develop it would be supportive of Europe given its low technology weight and the importance of financials, consumer staples and industrials to the European equity market. Within our global flagship Global Macro Multi Asset (GMMA) Portfolio we continue to hold US and EU financials while expressing our defensive positioning via a Minimum Volatile ETF within the US segment of the portfolio.
July’s strong global equity rebound coupled with current adverse seasonality suggests a cautious approach to equity risk assets. Seasonality does however favor UST and gold. The first half of the year it was all the US and tech; we do not expect this to be the case in the 2H.
PORTFOLIO STRATEGY AND ASSET ALLOCATION
Given our global growth outlook we continue to favor global equities with a modest overweight relative to benchmark while we remain underweight bonds and equal weight alternatives.
Within fixed income our bias remains to long duration UST and US HY credit; positive seasonality, trade risks, a hawkish Fed and limited signs of inflation support the UST position while favorable supply – demand characteristics, declining default rates and the lack of repayment mountains support the contrarian credit position. Our expectation for better EU growth & a stronger Euro leave us slightly underweight and unhedged in our non-US sovereign debt positions.
On a regional equity allocation basis we have reduced our US equity position and are now underweight. Small caps have performed well & protect against the 3 Ts; we maintain our position.
Europe remains our favored regional equity allocation & we remain overweight and exposed to core European equity as well as small caps and financials.
We remain underweight Asian equity given the region’s limited earnings growth, exposure to rising trade tensions and oil prices.
Within alternatives we remain exposed to broad commodities with a bias to oil and gold. US threats to impose sanctions on anyone importing Iranian oil suggest limited downside for both the global energy equity sector (a long standing TPWIM favorite) and oil prices.
Much of the commodity complex has corrected sharply, we are following Dr. Copper closely and looking at the Agriculture complex as a possible area to add to in the coming months.
Risks remain a plenty: the sentiment sapping threats of a trade war, the Nov. mid term elections & the Mueller investigation, an overly aggressive Fed leading to an inverted yield curve (though history suggests equities can do fine in that scenario), or an EM liquidity issue. These risks, many of which are hard to handicap, lie behind our decision to hold cash, gold and a significant UST position.
GLOBAL MACRO SUITE PORTFOLIO CHANGES
Global Macro Multi Asset (GMMA)
- We exited our US Consumer Discretionary position after July’s rally to further lower our exposure to both the US and Cyclicals.
- We added to our High Yield Bond position and believe it will continue to benefit from solid fundamentals & the search for yield.
Global Macro Income (GMI)
- We reduced our position in Mortgage Backed Securities and added to Local Currency Emerging Market Bonds and High Yield Bonds, seeking to pick up yield in a seasonally favorable period for fixed income.
Global Macro Equity (GME)
- We likewise eliminated our position in US Consumer Discretionary and added to our position in the Euro Zone Equities, increasing our European overweight while going further underweight the US equity market.
We hope you find this new piece of value and look forward to engaging with you on a monthly and quarterly basis.
Jay Pelosky, CIO & Co-Founder
TPW Investment Management
Past performance is no guarantee of future results. The material contained herein as well as any attachments is not an offer or solicitation for the purchase or sale of any financial instrument. It is presented only to provide information on investment strategies, opportunities and, on occasion, summary reviews on various portfolio performances. Returns can vary dramatically in separately managed accounts as such factors as point of entry, style range and varying execution costs at different broker/dealers can play a role. The material contains the current opinions of the author, which are subject to change without notice. Statements concerning financial market trends are based on current market conditions, which will fluctuate. References to specific securities and issuers are for illustrative purposes only and are not intended to be, and should not be interpreted as, recommendations to purchase or sell such securities. Forecasts are inherently limited and should not be relied upon as an indicator of future results. There is no guarantee that these investment strategies will work under all market conditions, and each advisor should evaluate their ability to invest client funds for the long-term, especially during periods of downturn in the market. Some products/services may not be offered at certain broker/dealer firms.
There can be no assurance that the purchase of the securities in this portfolio will be profitable, either individually or in the aggregate, or that such purchases will be more profitable than alternative investments. Investment in any TPWIM Portfolios, or any other investment or investment strategy involves risk, including the loss of principal; and there is no guarantee that investment in TPWIM’s Portfolios, or any other investment strategy will be profitable for a client’s or prospective client’s portfolio. Investments in TPWIM’s Portfolios, or any other investment or investment strategy, are not deposits of a bank, savings and loan or credit union; are not issued by, guaranteed by, or obligations of a bank, savings and loan, or credit union; and are not insured or guaranteed by the FDIC, SIPC, NCUSIF or any other agency.
The investment descriptions and other information contained in this are based on data calculated by TPW Investment Management, LLC (TPWIM) and other sources including Bloomberg. This summary does not constitute an offer to sell or a solicitation of an offer to buy any securities and may not be relied upon in connection with any offer or sale of securities. This report should be read in conjunction with TPWIM’s Form ADV Part 2A and Client Service Agreement, all of which should be requested and carefully reviewed prior to investing.


