3 Keys to the 2nd Half Game Plan
The first half of the year brought both higher volatility and lower financial asset returns – both of which were expected and discussed in our 2018 outlook. What was not expected was the sharp divergence between US growth and that of the non-US developed economies, especially Europe. This resulted in a stronger than expected USD which coupled with a more aggressive Fed led to market pressure against several emerging economies whose current account profiles, oil import needs or domestic political environment left them exposed. While the resultant selloff in EM assets was significant the good news is that currency flexibility allowed for EM adjustment, unlike during prior periods of EM weakness.
3 QUESTIONS FOR THE 2ND HALF
The 2nd half of the year is likely to remain challenging. From a secular point of view, trade and tech tensions reinforce our Tri Polar World (TPW) thesis of regional integration. Tactically, the Fed is in motion, oil prices are at multi year highs and the Three Ts (Trump, Trade & Tariffs) continue to generate that which markets hate most: uncertainty.
Amidst the noise, three main questions stand out.
- First, will relatively strong global growth (forecast at 3.9% this year and next) overcome rising trade tensions?
- Second, will the US – EU growth divergence noted above persist through year-end?
- The third, related Q is whether the relative outperformance of US equity (led by tech related growth and momentum equity) sustains itself or will there be a regional/sectoral rotation as the year progresses?
Lets address each question in turn and then move to portfolio positioning. Its important to begin by noting that the macro pillars we review seem in good shape: from growth, inflation & rates, to earnings, FX & commodities. Liquidity is in process of ebbing but financial conditions remain relatively loose and the cost of money remains very low, especially in real terms. Should trade tensions deepen and risk assets sell off, the Powell Fed could need to pause its rate hike cycle, something few are considering.
SOLID GLOBAL GROWTH VS TRADE TENSIONS – WHO WINS?
We expect strong global growth to outweigh rising global trade tensions. While tough trade talk, tariff implementation & reaction will lead to continued bouts of volatility they are unlikely to throw the entire global economy into recession. Absent dramatic tariff escalation, trade tensions are likely to have bigger headline than bottom line impact. Recent economic data suggests non-US growth is picking up after a slow start to the year with better data (PMIs, IP, LEI) coming out of Europe & Japan in particular.
Europe’s large current account surplus does leave it exposed to President Trump’s trade wrath. Auto tariffs would seem to be the thing to watch – there has been recent talk of zero tariffs but any deal will take time as Brussels negotiates for Europe while WTO rules are strict regarding sector specific bilateral trade deals.
China is also exposed given its large trade surplus with the US but China’s overall current account was actually in deficit in Q1. There has been talk of China using its currency as a trade weapon; more likely is a controlled weakening supported by a better backdrop in terms of reserves and two-way currency flows than in the last bout of Yuan weakness in 2015-16. Significant Yuan weakness would be deflationary as would further material commodity price declines. Broad Asia is exposed to trade risk as well as rising oil prices.
Tough trade talk from Pres. Trump plays well to his political base while being one of his few core beliefs suggesting continued trade friction up to the November US mid term elections. The disparity between economic and financial asset impact is due in part because forward discounting financial markets hate uncertainty. There is also the earnings effect to consider as companies are forced to either pass tariff hikes along to customers, thus risking higher inflation or swallow the tariff impact and risk an earnings miss. This is especially true in the US where second half earnings expectations are high and room to disappoint low.
Our view remains that US economic nationalism will fail to upend the global economy. Trade risk implies more easing in China, supporting global growth while a strong US economy provides the footing for a more aggressive US trade posture, suggesting that any softening in US economic activity could lead to a reduction in trade tensions.
US –EU GROWTH PATHS TO CONVERGE?
Our second key question pertains to the sustainability of the US – EU growth divergence. We expect more convergence than divergence in the second half of the year. The surprise to date has been the sharp fall off in European growth. The US growth path has been pretty much as expected with limited lift to date from either tax cuts, consumer demand pick up or cap ex. The US economic expansion is now the second longest post war recovery on record and could be vulnerable to continued trade friction that would dampen the C suite confidence, capital investment and wage gains needed to boost productivity and extend the growth cycle. In addition, as the US twin deficits grow, it stands to reason that either rates will have to back up or the USD decline to entice offshore capital to fund them.
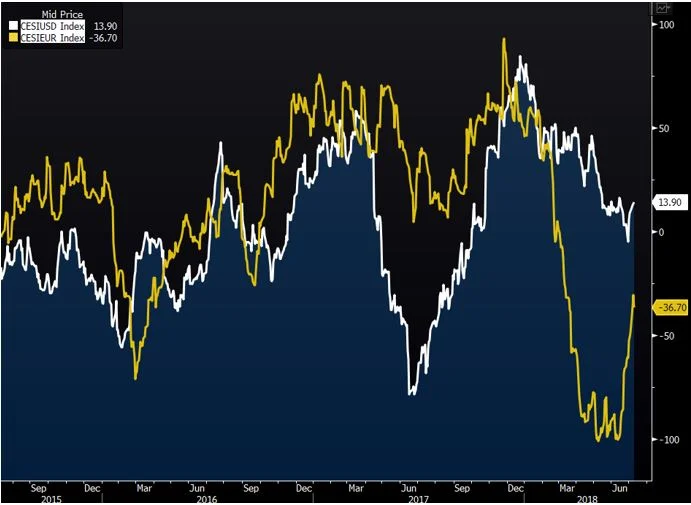
On the other side of the pond, Europe grew well above its potential growth rate last year. Thus, one could view its 1H 2018 slowdown as coming more in line with potential growth. Recent economic data points suggest the soft patch is coming to an end or at least has been fully factored in with Europe’s Citi Economic Surprise Index (CESI) picking up while that of the US rolls over as shown in Chart 1. Better data in terms of European Manufacturing and Service PMIs, continued employment growth & wage gains coupled with house price gains and solid loan growth support a growth rebound.
Chart 1: EU Growth Rebound Ahead?
Source: Bloomberg
With Europe’s most recent political risk flare-up over immigration and Germany’s governing coalition seemingly put to bed, headline political risk in Europe may finally be ebbing. It has been two full years of such, ranging from Brexit to the French election to Spanish secession risk to Italian populism to German party conflicts. As we approach the US midterms and the likely end of the Mueller investigation one could see political risk rise in the US and ebb in Europe.
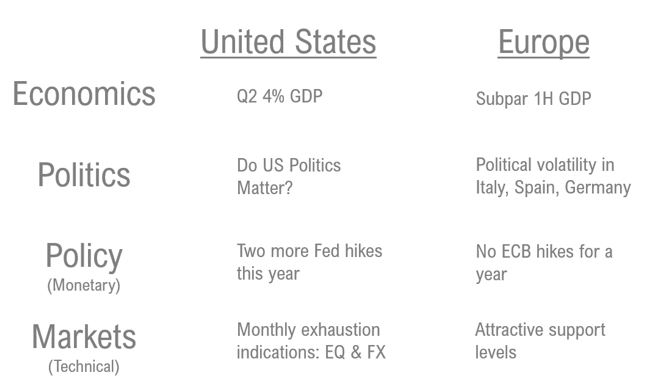
As Table 1 indicates, our Global Risk Nexus (GRN) Scoring System has noted that US – EU divergences extend from economics to politics, policy and markets. One wonders if the divergences are not close to their wides just as EU focused equity funds have suffered 17 straight weeks of outflows, totaling $45B. Many sell side firms have cut their EU equity positions and raised their US positions. Europe is more exposed to trade friction & tends to be high beta to the downside but much appears in the price with EU auto stocks for example down between 15-20% ytd.
Table 1: Peak US/EU Divergence?
Source: TPWIM
US TECH TO CONTINUE LEADING?
The third question concerns US equity leadership and within the US, growth vs. value. US equity outperformed the rest of the world in the first half while within the US, growth and momentum equities rose roughly 6-8% in the first six months of the year while value stocks fell 2%. The tech and consumer discretionary sectors have led the way in the US & much of our recent work suggests the tech sector is extended on a number of fronts. We continue to believe we are in the early stages of a shift to non-US equity leadership and view a broadening out of equity leadership within the US as a positive.
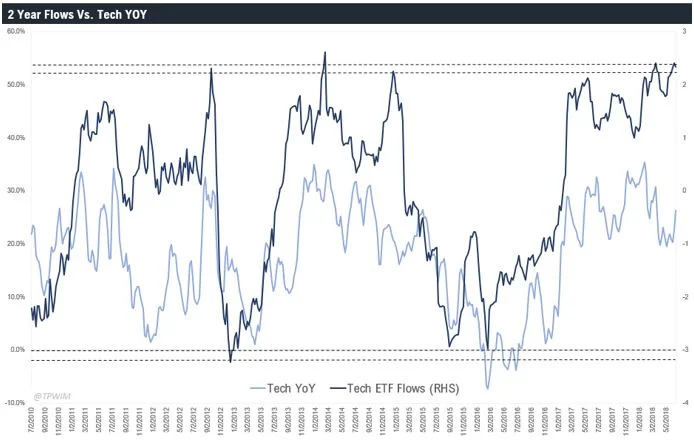
History suggests that with the the top five stocks (all tech) generating over 50% of SPY performance in the 1st H further upside would be limited. Chart 2 illustrates a second concern revolving around tech fund inflows which at 2 st dev above the norm also suggest caution is advisable. A third, underappreciated, tech risk is the possible negative impact of the strong dollar on upcoming tech earnings given that many of tech sector’s leading stocks generate 50% or more of revenue abroad. Strong relative performance leading to sizable fund inflows coupled with potential earnings risk suggests caution on the tech front.
Chart 2: Extended Tech Flows Suggest Caution
Source: TPWIM
Further upside would seem to require that US sector leadership broaden out beyond tech & consumer discretionary. Small caps also did well in the first half as did energy but it would be good to see US financials, hemmed in by the flattening yield curve, start to perform. This internal divide exists across the Atlantic as well. European value stocks trade at relative levels not seen since the onset of the 1990s, a 4 st dev move. At the same time, earnings revisions are turning up while sentiment remains depressed. European financials have also struggled in part due to the ECB’s statement that it doesn’t plan to raise rates for a year. A growth pick up in Europe could lead to a steepening yield curve and rising bank stocks.
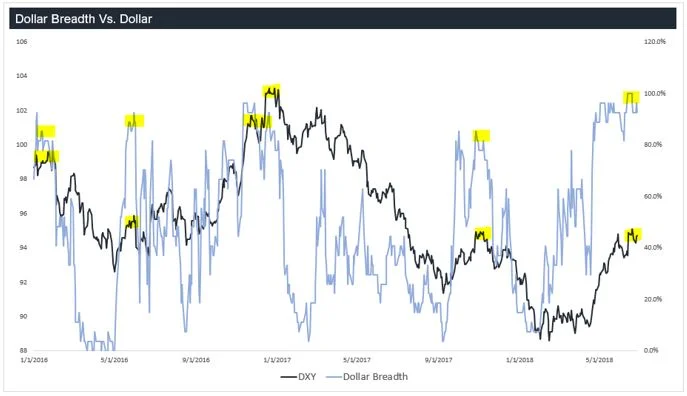
Currency is likely to play an important role in the 2H. USD strength was one of the first half’s big surprises; whether it sustains or reverts to USD weakness is a key consideration. Chart 3 suggests USD exhaustion and we expect USD weakness to reassert itself. The Euro is likely to switch from a headwind to a tailwind for 2H European equity earnings while the USD, which has been a tailwind, is now switching to a headwind, one that could really impact tech as noted above. If tech earnings disappoint that could be one of the main catalysts for a shift in performance across equities, both regionally and sectorally within the US. Tech underperformed in June while defensives outperformed and while its too early to call it a trend its something that bears careful watching.
Chart 3: Dollar Exhaustion Suggesting Turning Point
Source: TPWIM, Bloomberg
PORTFOLIO STRATEGY AND ASSET ALLOCATION
Given our global growth outlook we continue to favor global equities with a modest overweight relative to benchmark while we remain underweight bonds and equal weight alternatives.
Within fixed income our bias remains to long duration UST and US HY credit; trade risks, a hawkish Fed and limited signs of inflation support the UST position while favorable supply – demand characteristics, declining default rates and the lack of repayment mountains support the contrarian credit position. Our expectation for better EU growth & a stronger Euro leave us slightly underweight and unhedged in our non-US sovereign debt positions.
On a regional equity allocation basis we are neutral US equity. Small caps have performed well & protect against the 3 Ts; we maintain our position.
Europe remains our favored regional equity allocation though we have slightly reduced our overweight. We remain exposed to core European equity as well as small caps and financials.
We have further reduced our Asian equity exposure given Japan’s limited growth profile and the region’s exposure to rising trade tensions and oil prices.
Within alternatives we remain exposed to broad commodities with a bias to oil and gold. US threats to impose sanctions on anyone importing Iranian oil suggest limited downside for both the global energy sector (a long standing TPWIM favorite) and oil prices.
Much of the commodity complex has corrected sharply, we are following Dr. Copper closely and looking at the Agriculture complex as a possible area to add in coming months.
Risks remain a plenty: sentiment sapping threats of a trade war, the Nov. mid term elections & the Mueller investigation, an overly aggressive Fed leading to an inverted yield curve (though history suggests equities can do fine in that scenario), an EM liquidity issue or even more political risk in Europe are all viable. These risks, many of which are hard to handicap, lie behind our decision to raise cash, add to our gold exposure and hold significant UST positions.
GMMA PORTFOLIO CHANGES
EQUITY
- We have exited our Greece equity position following the country reaching an accord with its creditors.
- We have sold our direct China and Indonesia positions given China’s exposure to rising trade risks & Indonesia’s large current account deficit and exposure to rising oil prices allowing us to switch into a pan Asian equity holding.
- We have raised cash slightly to 5%, reflecting the risks noted above.
FIXED INCOME
- We have added to our UST position while eliminating our EM local currency debt position based on continued trade concerns and rising political risk in Latin America.
ALTERNATIVES
- We have recently added to our gold exposure.
We hope you find this 2nd Half Outlook of value and look forward to engaging with you on a monthly and quarterly basis as we continue to develop TPW Investment Management.
Jay Pelosky, CIO & Co-Founder
TPW Investment Management
Past performance is no guarantee of future results. The material contained herein as well as any attachments is not an offer or solicitation for the purchase or sale of any financial instrument. It is presented only to provide information on investment strategies, opportunities and, on occasion, summary reviews on various portfolio performances. Returns can vary dramatically in separately managed accounts as such factors as point of entry, style range and varying execution costs at different broker/dealers can play a role. The material contains the current opinions of the author, which are subject to change without notice. Statements concerning financial market trends are based on current market conditions, which will fluctuate. References to specific securities and issuers are for illustrative purposes only and are not intended to be, and should not be interpreted as, recommendations to purchase or sell such securities. Forecasts are inherently limited and should not be relied upon as an indicator of future results. There is no guarantee that these investment strategies will work under all market conditions, and each advisor should evaluate their ability to invest client funds for the long-term, especially during periods of downturn in the market. Some products/services may not be offered at certain broker/dealer firms.
There can be no assurance that the purchase of the securities in this portfolio will be profitable, either individually or in the aggregate, or that such purchases will be more profitable than alternative investments. Investment in any TPWIM Portfolios, or any other investment or investment strategy involves risk, including the loss of principal; and there is no guarantee that investment in TPWIM’s Portfolios, or any other investment strategy will be profitable for a client’s or prospective client’s portfolio. Investments in TPWIM’s Portfolios, or any other investment or investment strategy, are not deposits of a bank, savings and loan or credit union; are not issued by, guaranteed by, or obligations of a bank, savings and loan, or credit union; and are not insured or guaranteed by the FDIC, SIPC, NCUSIF or any other agency.
The investment descriptions and other information contained in this are based on data calculated by TPW Investment Management, LLC (TPWIM) and other sources including Bloomberg. This summary does not constitute an offer to sell or a solicitation of an offer to buy any securities and may not be relied upon in connection with any offer or sale of securities. This report should be read in conjunction with TPWIM’s Form ADV Part 2A and Client Service Agreement, all of which should be requested and carefully reviewed prior to investing.


